Department of AI & ML has taken an initiative to conduct the workshop on POWER BI, which mainly focuses on data analysis and visualization. As a AI and ML engineers the current day market expects the professionals to derive the beautiful insights from their findings, hence as a part of generating interactive reports and dashboards using the data available this workshop plays important role. The workshop on POWER BI was planned and conducted for the 4th Semester students of AI & ML department.
Event Initiated and conducted detail:
Event was conducted from 22nd August 2022 to 24th August 2022 (10:00am to 1:00pm).
Mode of Conduction :Virtual Mode
Resource Person: Mr. Bhargava R, Sr. AP, AI&ML,NHCE
Day 1:
Introduction to Power BI and Visualization
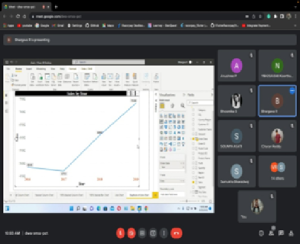
Participants joined the session through Google meet platform, Session was started by welcoming all the participants to the three day workshop on POWER BI. Resource person Mr. Bhargava R has explained about various BI tools available in the current day market and need for choosing POWER BI tool. He also explained how visualization plays important role in the data analytics. He explained few visualization charts in detail and also briefed about when to choose the right visualization depending on the data. He made students connect to the different data sources using power BI and getting data from them. He concluded the day1 by giving small self exploratory assignment to the students.
Day 2 :
More on Visualization
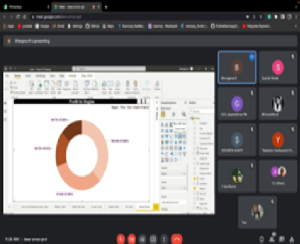
Day 2 session was started by checking the assignment given in the Day1 and asking students to explain about their understanding. Resource person explained about the more visualization charts like stacked column charts, stacked bar charts, clustered column charts, clustered column charts, donut charts, pie chart etc… He also explained about some of the custom charts like sun burst chart, play axis, ribbon charts and, radar charts etc… He made students to practice every chart along with understanding. During the session he also conveyed the students to think in the perspective of the business analyst and help in the growth of the business. Concluded the day2 session by telling the difference between cleaned data and incomplete data.
Day 3:
DAX
After day 2 students were able to create their own visualizations when the complete data is given. Day 3 was started by giving the incomplete data to the students and making them to learn new programming language called DAX ( Data Analysis Expressions).Students were given an insight about various DAX functions like create new column, new measure, within that various functions like Format, Month, Day, Date, Average, Min, Max, etc. After the session students were able to generate the data from the existing data using DAX.